enscyGraph
Advanced Graphing & Analysis
A powerful web-based graphing calculator. Visualize complex equations, perform robust regression analysis on datasets, and explore math with interactive tools.
Flexible Plotting
Graph any function, including standard `y = f(x)` expressions and implicit relations like `x = f(y)`.
Regression Analysis
Input data tables and instantly visualize Linear, Quadratic, Exponential, and Power regression models with R² values.
Share Workspaces
Generate unique URLs that save your expressions, tables, and viewport settings to share with others.
Analysis Tools
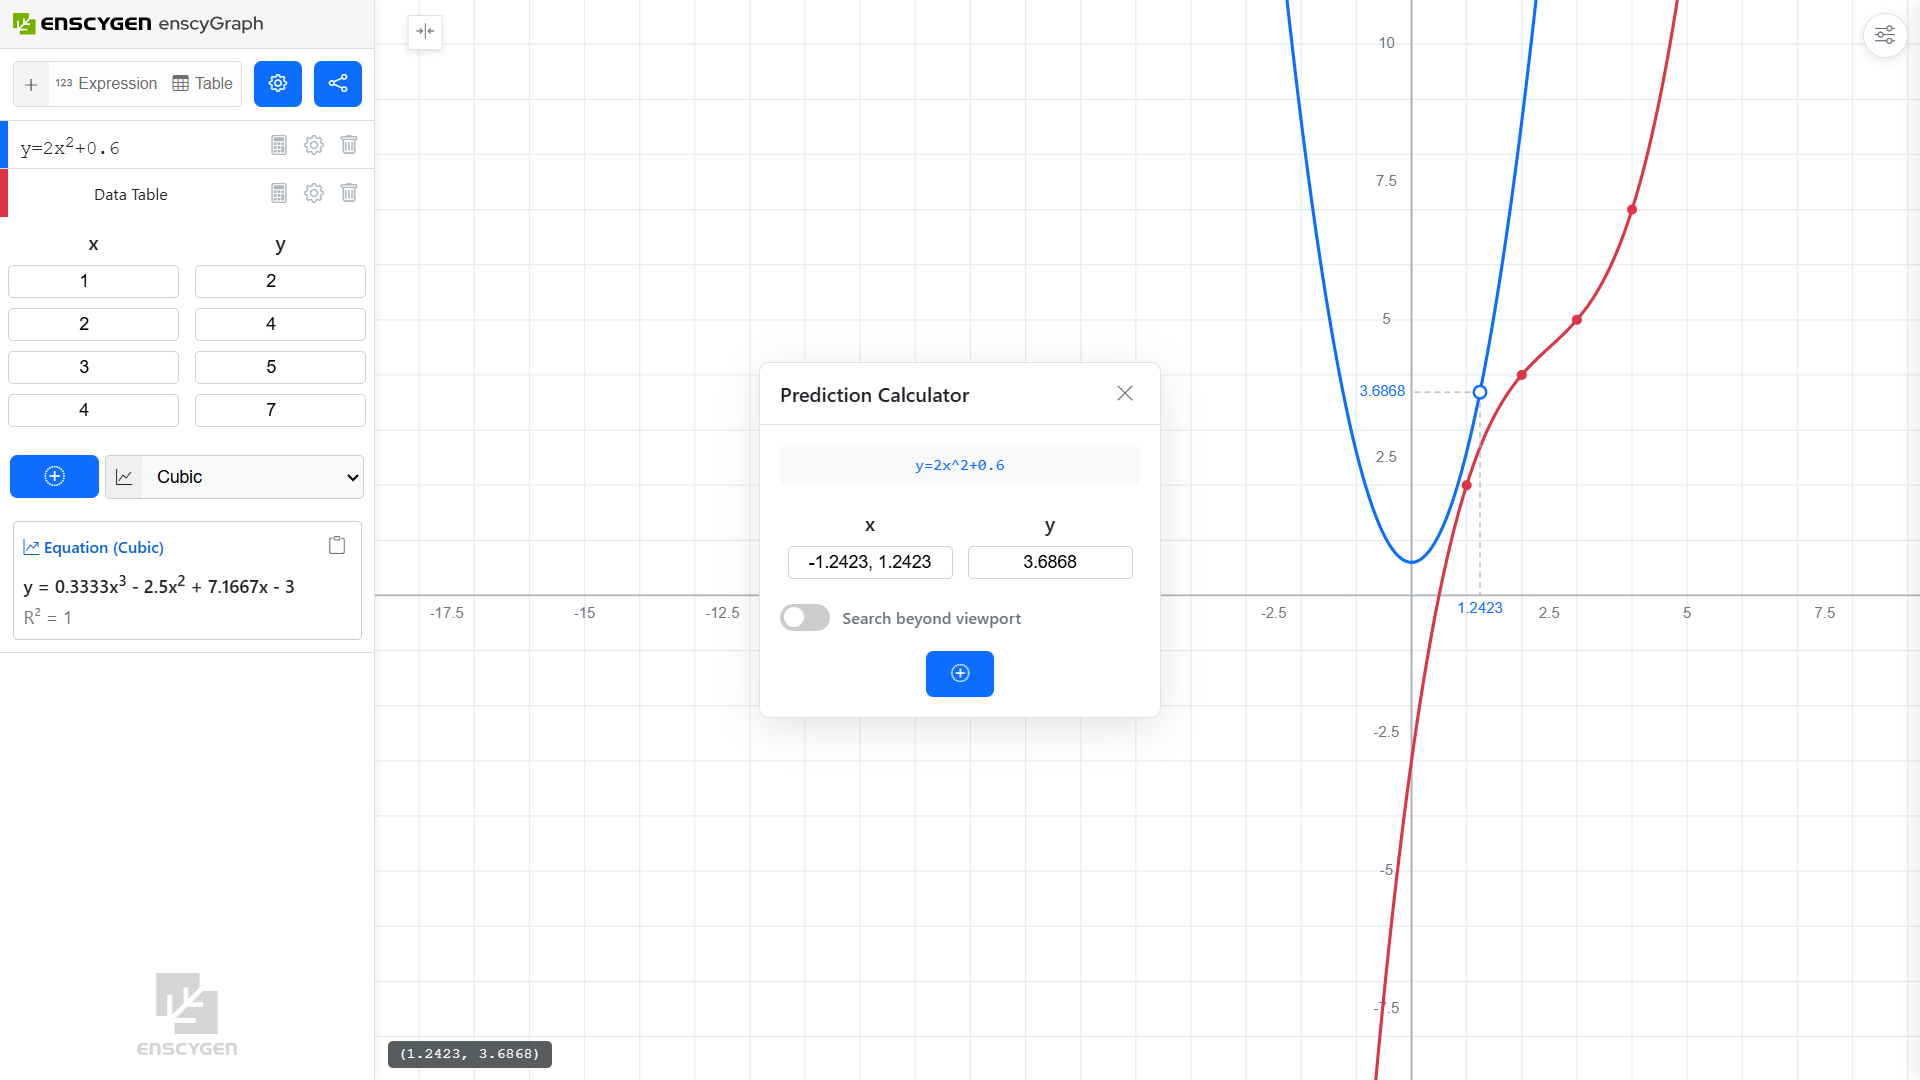
Robust Math Toolkit.
Beyond simple lines, EnscyGraph offers a Prediction Calculator to find exact `y` values for given `x` inputs (and vice versa) based on your regression models. Pin points of interest directly to the canvas for reference.
Interaction
Intuitive Exploration.
Seamlessly pan and zoom the graph with mouse or touch. Use axis-specific zooming (Shift/Ctrl + Scroll) to stretch or compress dimensions independently for precise analysis.
Who is EnscyGraph for?
Students
Visualize functions and check homework without expensive handheld calculators.
Educators
Demonstrate mathematical concepts and share live graph links with students.
Researchers
Perform quick regression analysis on experimental data sets directly in the browser.
How to Operate
1. Input Data
- Expression: Type functions like `y = x^2` or `sin(x)`.
- Table: Click "Table" to enter (x, y) coordinate pairs manually.
2. Analyze
- Select a table and choose a Regression Model (Linear, Quadratic, etc.) from the dropdown.
- Use the icon to open the Prediction Calculator.
3. Explore
- Trace: Hover over curves to see coordinates. Click to pin them.
- Zoom: Scroll to zoom. Hover over an axis to zoom only that dimension.
4. Share
- Click the icon to copy a unique link.
- This link restores your entire session, including data and view settings.