SCEA Graph
Advanced Scientific Graphing & Analysis
A high-performance web-based graphing engine designed for researchers. Visualize complex equations, perform robust regression analysis on datasets, and explore math with interactive tools directly in your browser.
High-Precision Modeling & Prediction.
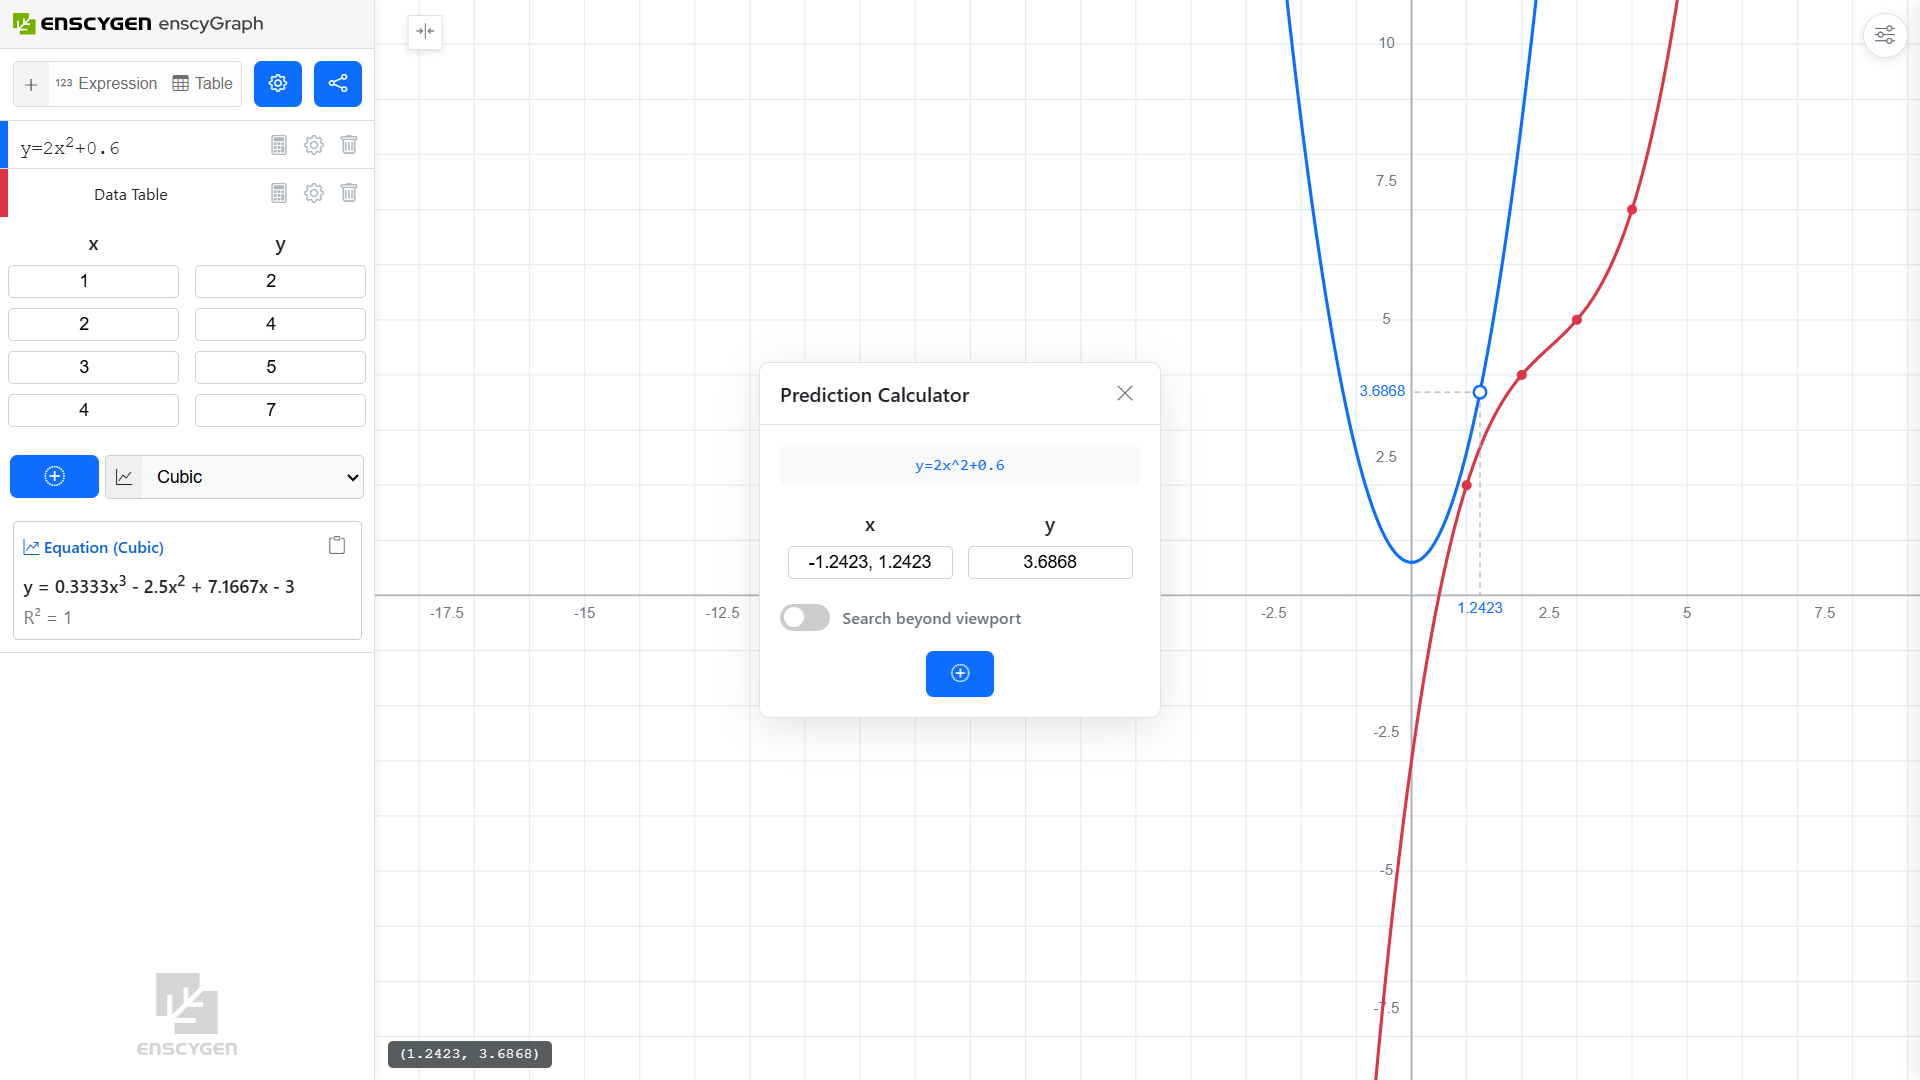
Beyond simple lines, SCEA Graph offers a Prediction Calculator to find exact Y values for given X inputs based on active regression models. Map points of interest directly to the coordinate plane for precise reference in laboratory reports and publications.
Core Capabilities
SCEA-Graph
Advanced scientific graphing engine featuring multi-model regression and bi-directional coordinate solving.
Regression Modeling
Instantly visualize Linear, Quadratic, and Exponential models with real-time R-squared values for statistical proof.
Axis-Specific Zoom
Stretch dimensions independently with axis-constrained scrolling to analyze data across extreme scales.
Persistent Workspaces
Generate unique URLs that encapsulate your expressions, tables, and viewport settings for collaborative research.
How to Operate
Type functions like y = x squared or import CSV coordinate pairs manually for localized regression modeling.
Select your data table and choose a Regression Model. Use the prediction tool for exact coordinate solving.
Hover to trace coordinates and click to pin points of interest directly to the localized browser canvas.
Powerful, localized graphing engine—no installation required.