What is EnscyGraph?
EnscyGraph is a powerful and intuitive web-based graphing calculator designed for students, educators, and researchers. It combines a flexible function plotter with a robust data analysis toolkit, allowing you to visualize complex equations, analyze data sets with advanced regression models, and explore your graphs with fully interactive controls. Customize your visuals, pin points of interest, and share your entire workspace with a single, shareable link.
Key Features:
- Flexible Function Plotting: Graph any function, including standard `y = f(x)` expressions and implicit relations like `x = f(y)`.
- Data Tables & Advanced Regression: Input data points into a table and instantly visualize various regression models, including Linear, Quadratic, Cubic, Exponential, Logarithmic, and Power, complete with R² values.
- Interactive Viewport: Seamlessly pan and zoom the graph with your mouse or touch gestures. Utilize axis-specific zooming for precise control over your view.
- Point Tracing & Analysis: Hover over any curve to see a highlighted point with its coordinates and dotted lines to the axes. Click to "pin" points of interest to the graph for further analysis or export.
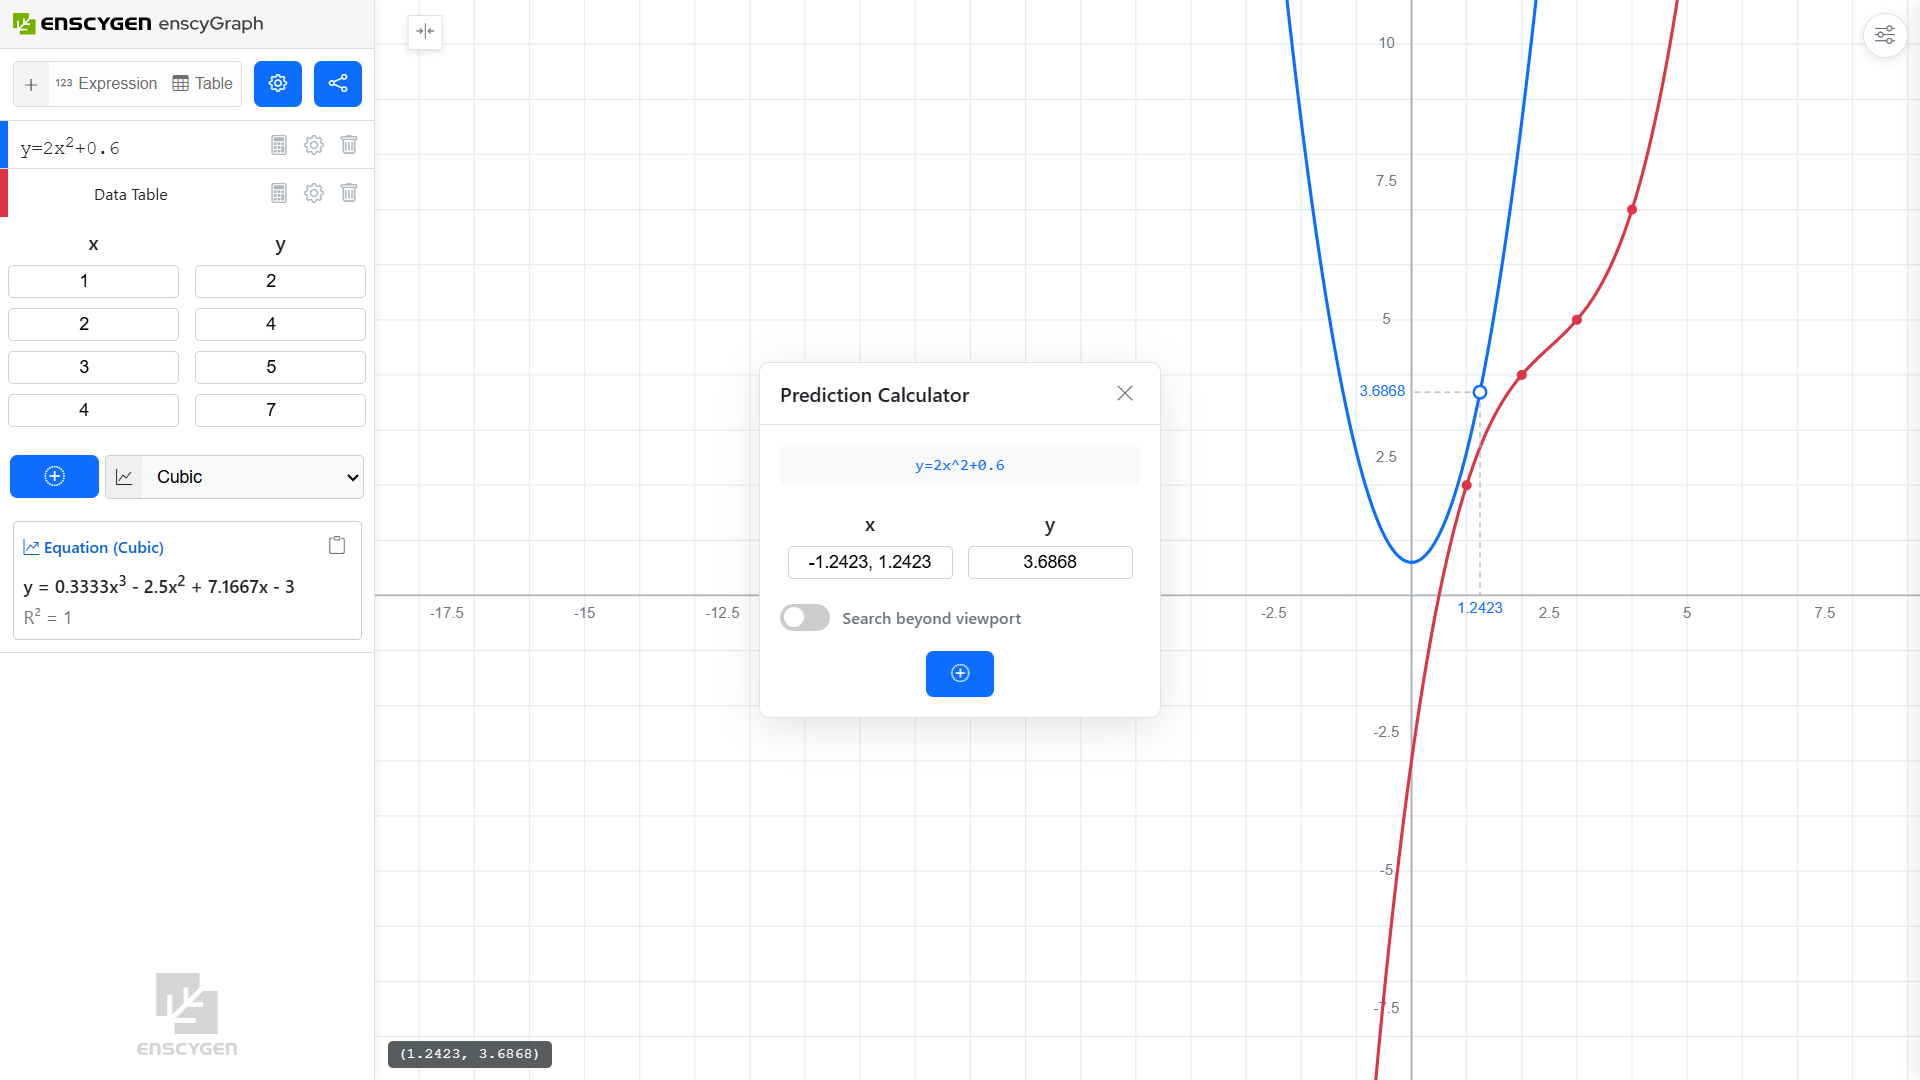
- Prediction Calculator: For any function or regression model, open an interactive calculator to find the `y` value for a given `x`, or find the corresponding `x` value(s) for a given `y`.
- Customizable Visuals: Use the off-canvas settings panel to lock the viewport, set square units, center the origin, and adjust the decimal precision for all calculations.
- Shareable Workspaces: Generate a unique URL that saves your current expressions and data tables, allowing you to easily share your work with others or bookmark it for later.
- Modern Interface: A sleek, compact, and professional design with a collapsible side panel to maximize the graphing area.
How to Operate EnscyGraph: A Step-by-Step Guide
-
Enter an Expression or Table:
- Click the "Expression" button to add a new input field. Type any valid mathematical function (e.g., `sin(x)`, `y = x^2`, or `x = y^2`). The graph will update in real-time.
- Click the "Table" button to add a new data set. Enter your (x, y) coordinate pairs.
-
Analyze Table Data:
- With a table selected, use the dropdown menu below it to choose a regression model. The best-fit line and its equation (with R² value) will appear instantly.
- Click the icon on the table to open the Prediction Calculator and find values based on the model.
-
Explore the Graph:
- Pan: Click and drag anywhere on the graph to move the view.
- Zoom: Use your mouse wheel or a pinch gesture to zoom in and out.
- Axis-Specific Zoom: Hover over the X or Y axis and scroll to zoom only that axis.
- Trace Points: Move your cursor over any plotted line to see its coordinates. Click to pin the point to the graph. Click a pinned point again to delete it.
-
Adjust Visuals:
- Click the icon in the top-right corner to open the Visual Tools panel.
- Here, you can set the axis range by typing, center the origin, set square units, or lock the viewport to prevent changes.
-
Share Your Work:
- Click the icon in the main panel to copy a shareable link to your clipboard. This link will restore your exact session, including all expressions and tables.